 Money in One Chart
where money goes
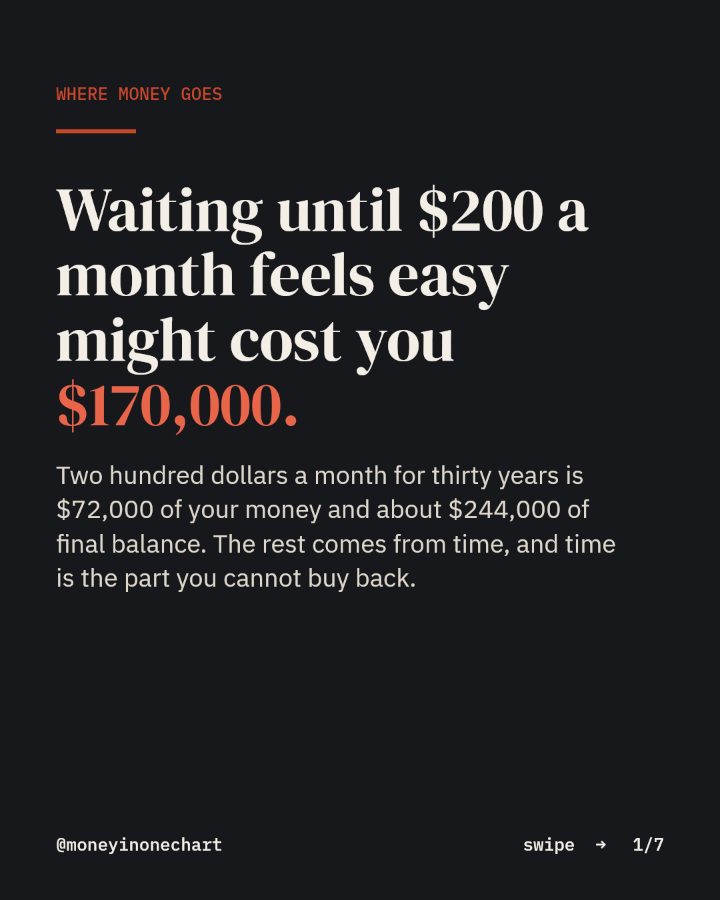
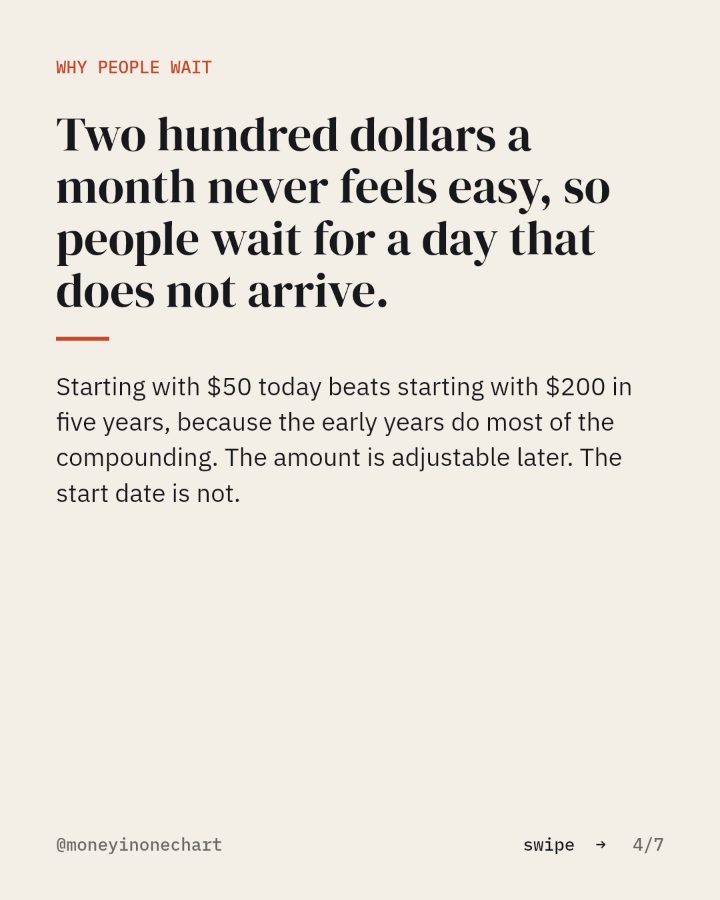
Waiting until $200 a month feels easy might cost you $170,000.
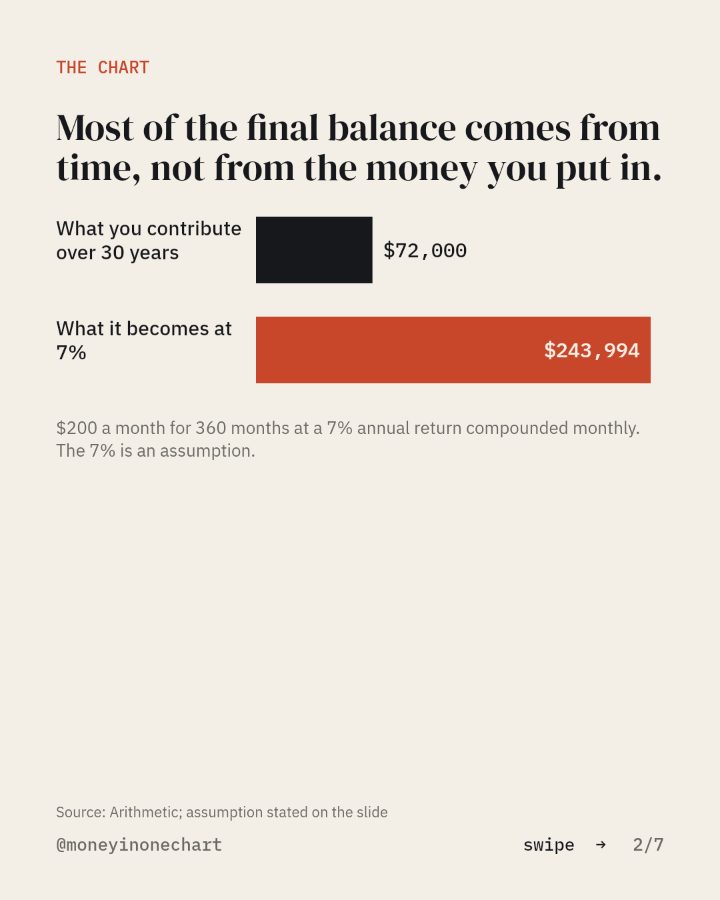
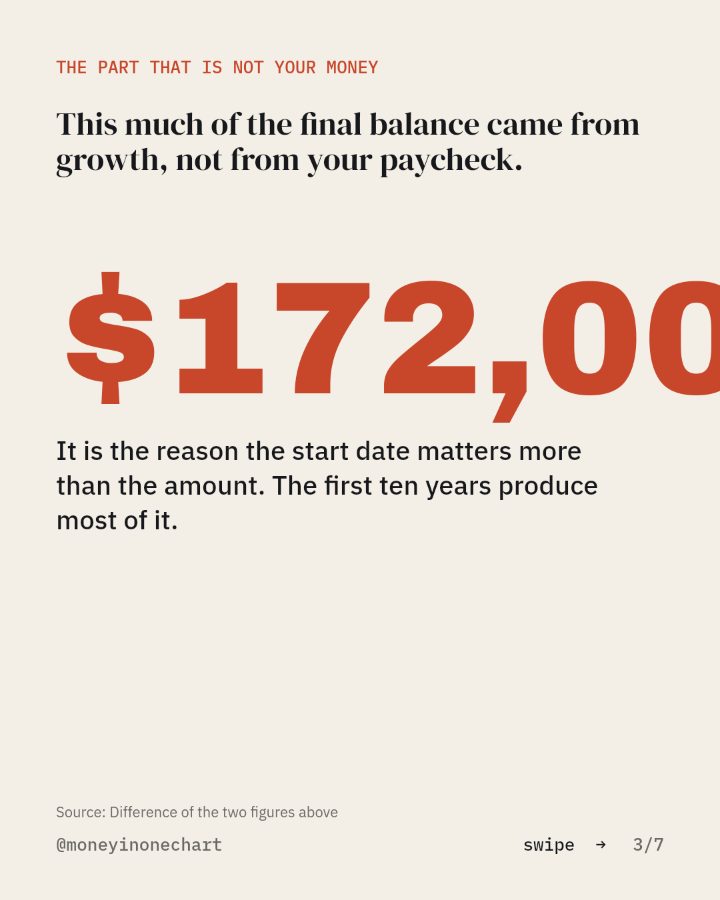
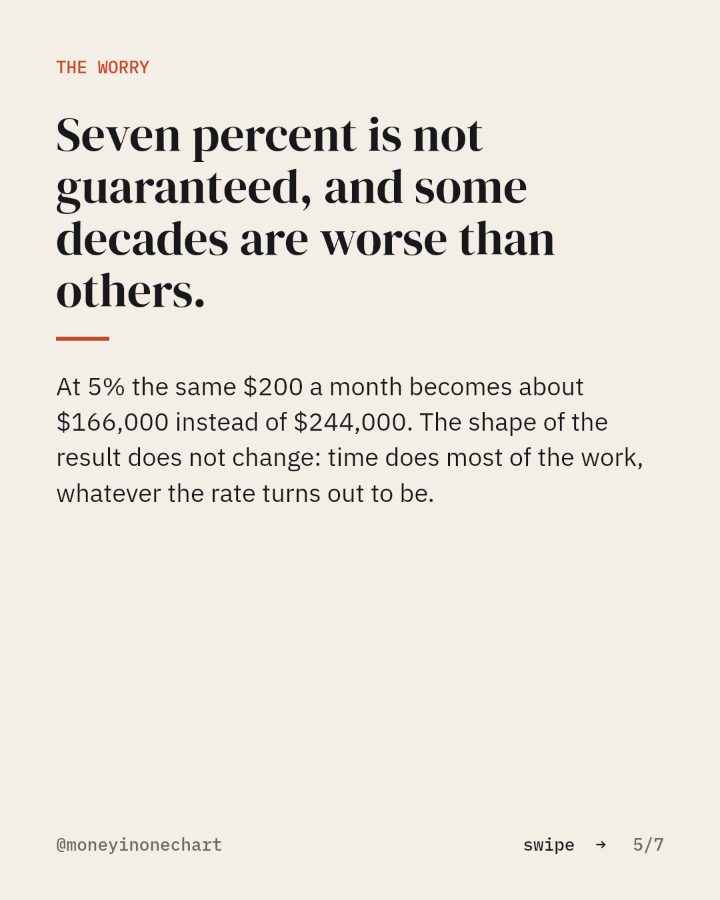
Two hundred dollars a month for thirty years is $72,000 of your money and about $244,000 of final balance. The rest comes from time, and time is the part you cannot buy back.
You asked for the compounding sheet. It is below, as the slides from the post, then the one move, then the tool the chart points at.
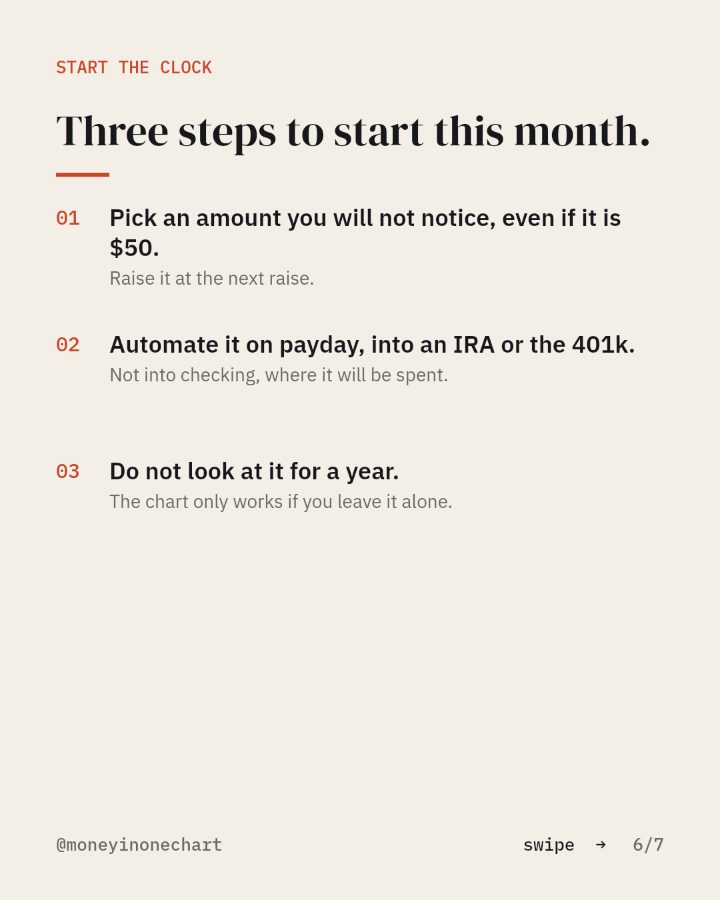
Three steps to start this month.
- 01Pick an amount you will not notice, even if it is $50.Raise it at the next raise.
- 02Automate it on payday, into an IRA or the 401k.Not into checking, where it will be spent.
- 03Do not look at it for a year.The chart only works if you leave it alone.
The tool this chart points at
A low-fee brokerage
For the IRA, the index fund and the rollover. Broad index funds with expense ratios under 0.1%.
Open itThis link may pay Money in One Chart a referral fee if you open an account. Your price does not change. How that works.
Sources: Arithmetic; assumption stated on the slide; Difference of the two figures above.