 Money in One Chart
where money goes
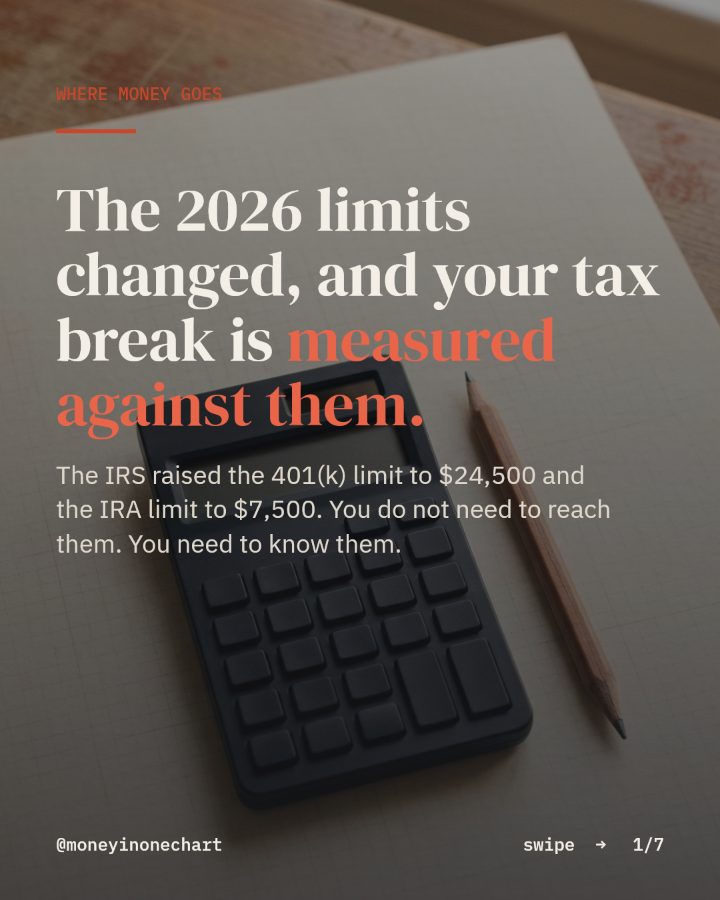
The 2026 limits changed, and your tax break is measured against them.
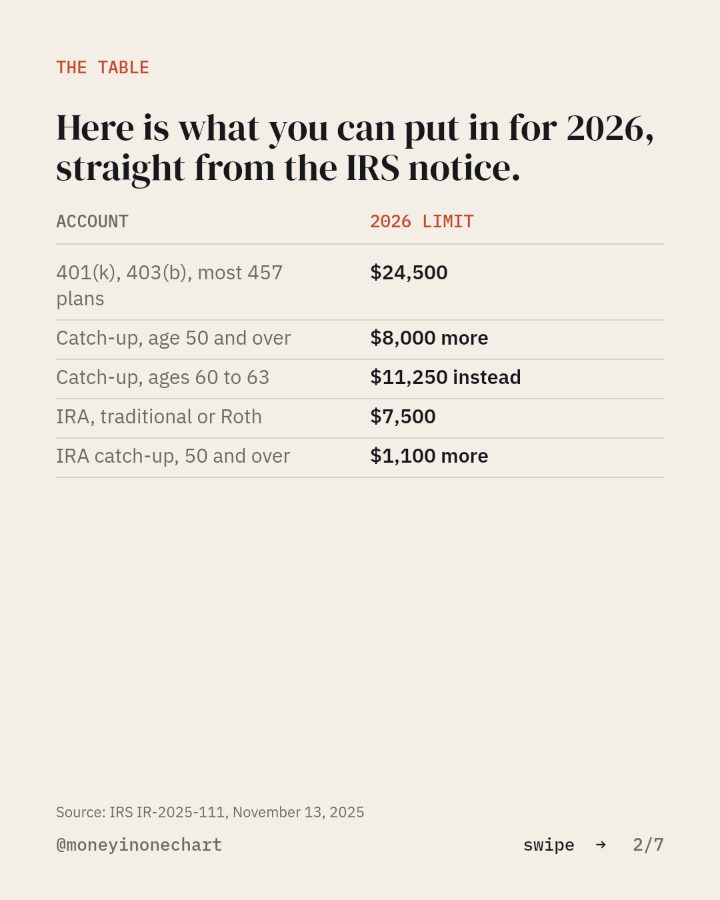
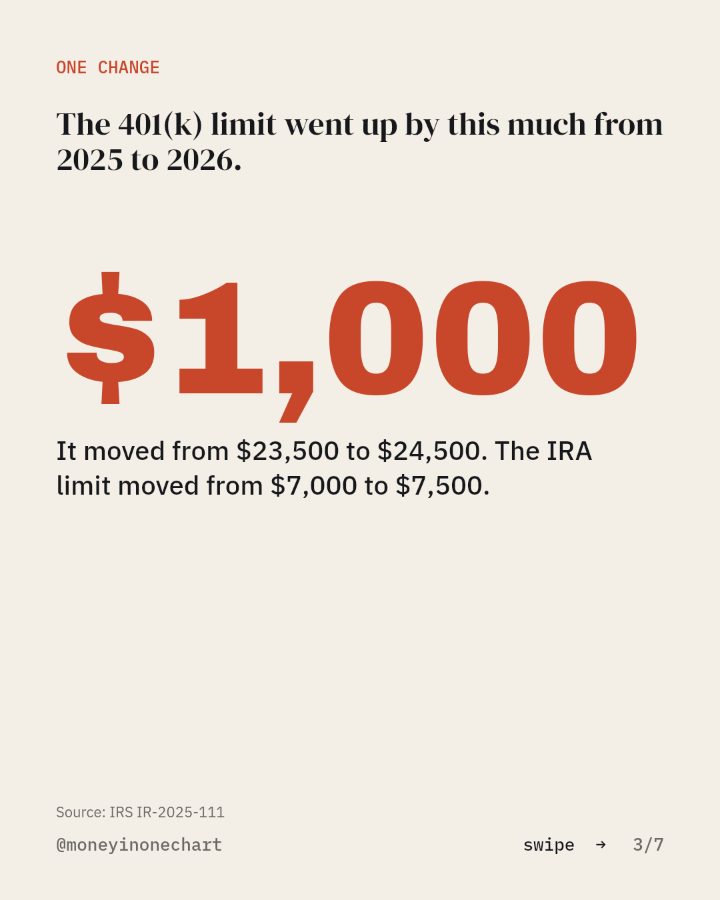
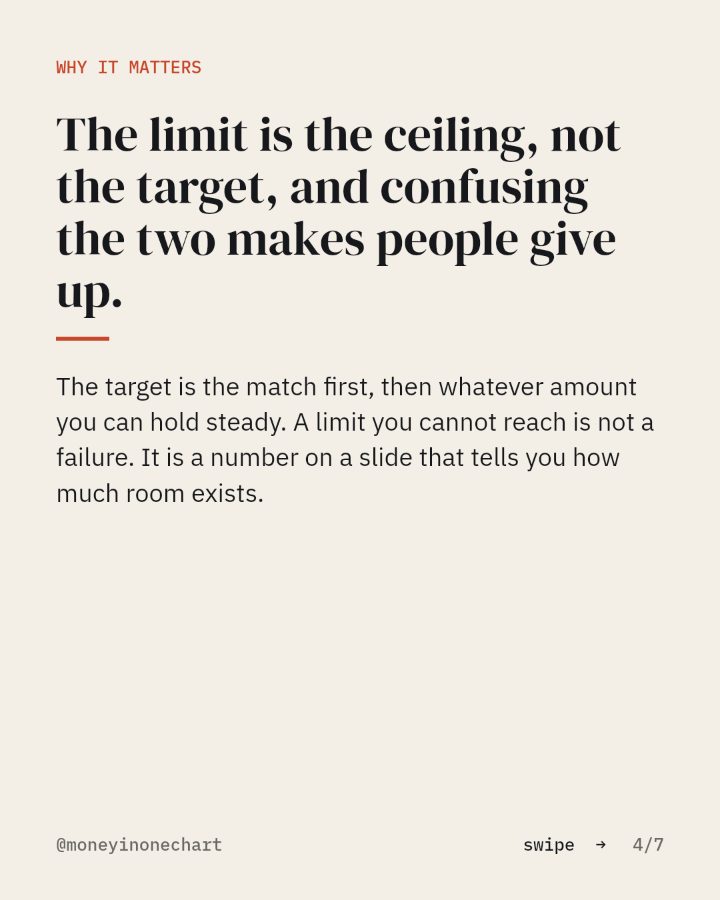
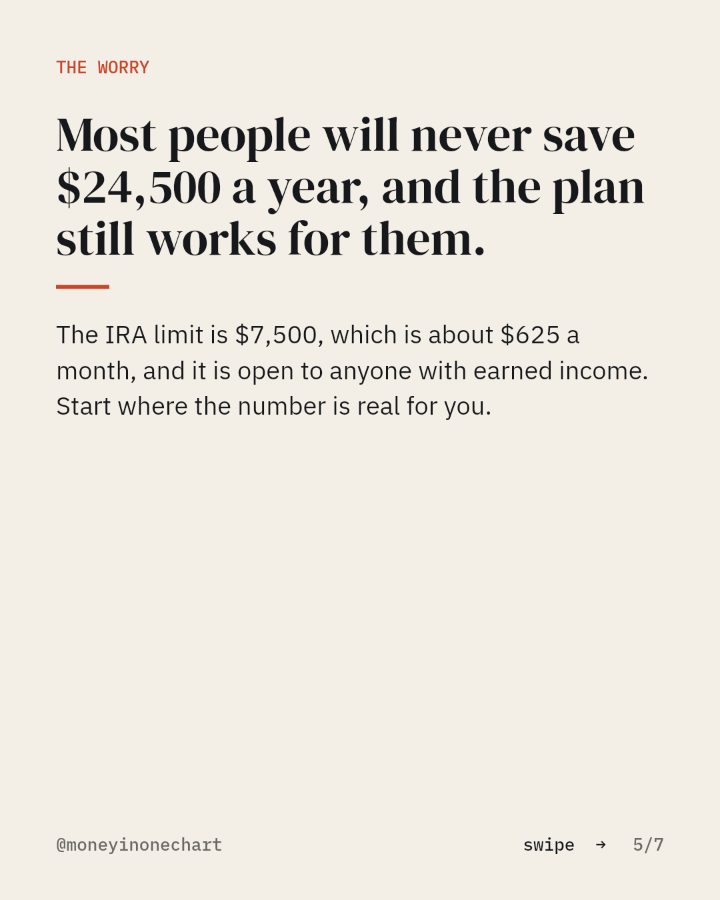
The IRS raised the 401(k) limit to $24,500 and the IRA limit to $7,500. You do not need to reach them. You need to know them.
You asked for the 2026 limits card. It is below, as the slides from the post, then the one move, then the tool the chart points at.
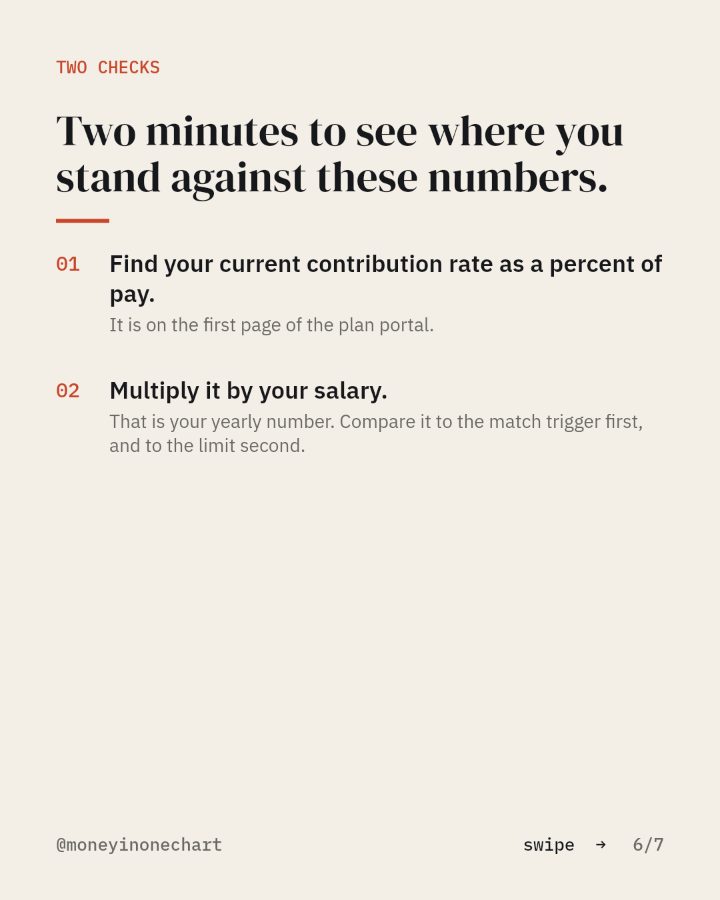
Two minutes to see where you stand against these numbers.
- 01Find your current contribution rate as a percent of pay.It is on the first page of the plan portal.
- 02Multiply it by your salary.That is your yearly number. Compare it to the match trigger first, and to the limit second.
The tool this chart points at
A low-fee brokerage
For the IRA, the index fund and the rollover. Broad index funds with expense ratios under 0.1%.
Open itThis link may pay Money in One Chart a referral fee if you open an account. Your price does not change. How that works.
Sources: IRS IR-2025-111, November 13, 2025; IRS IR-2025-111.