 Money in One Chart
where money goes
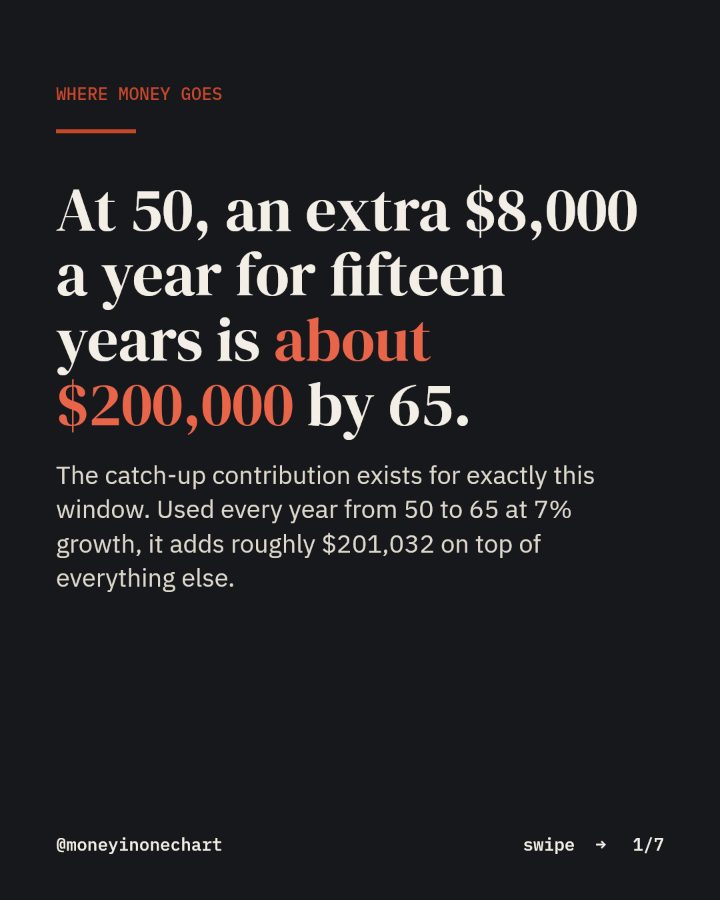
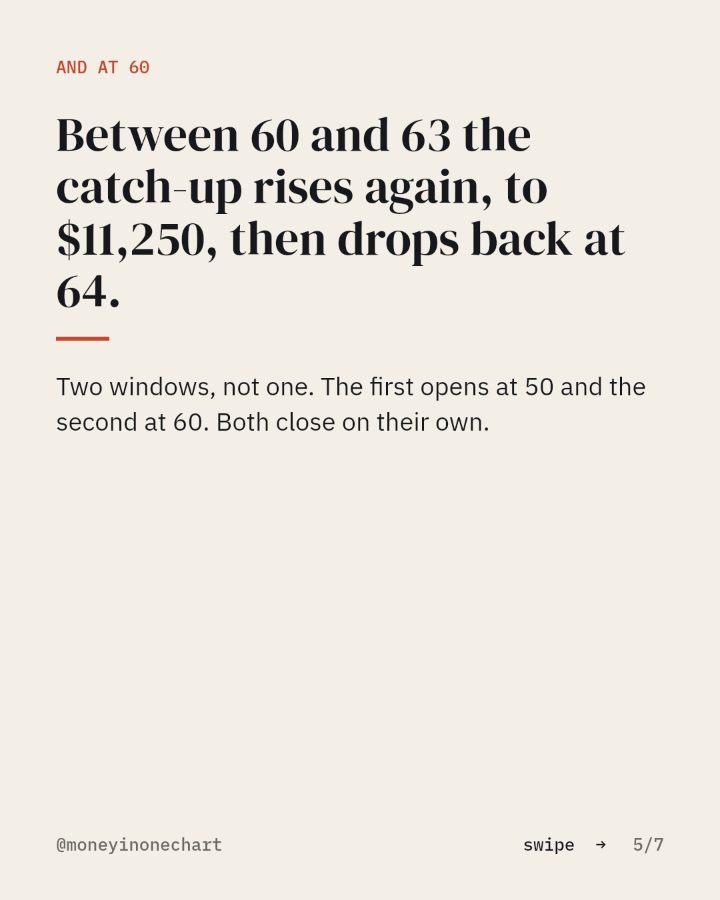
At 50, an extra $8,000 a year for fifteen years is about $200,000 by 65.
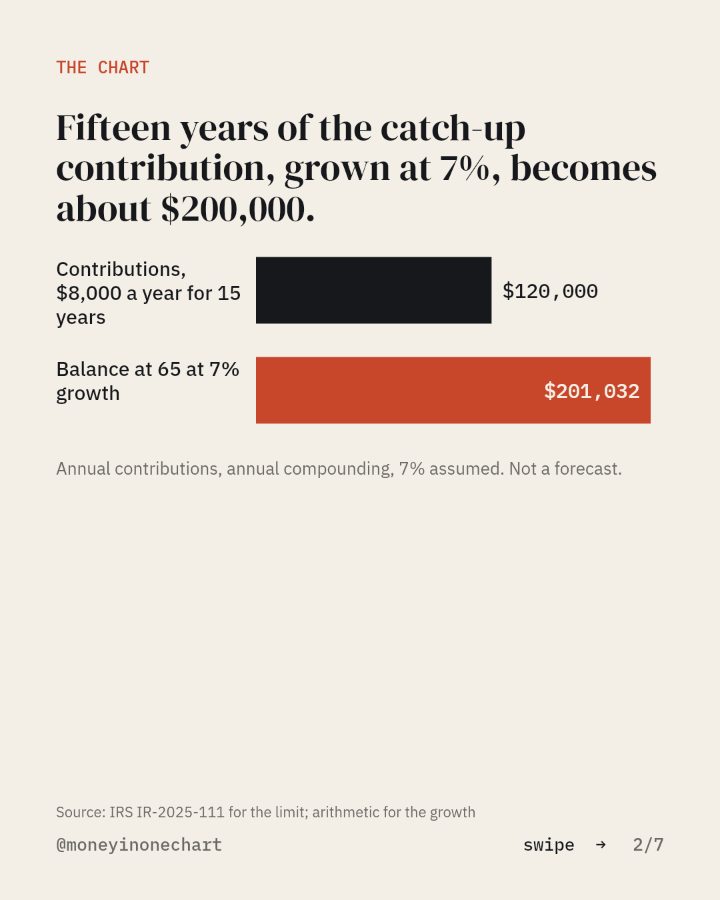
The catch-up contribution exists for exactly this window. Used every year from 50 to 65 at 7% growth, it adds roughly $201,032 on top of everything else.
You asked for the catch-up card. It is below, as the slides from the post, then the one move, then the tool the chart points at.
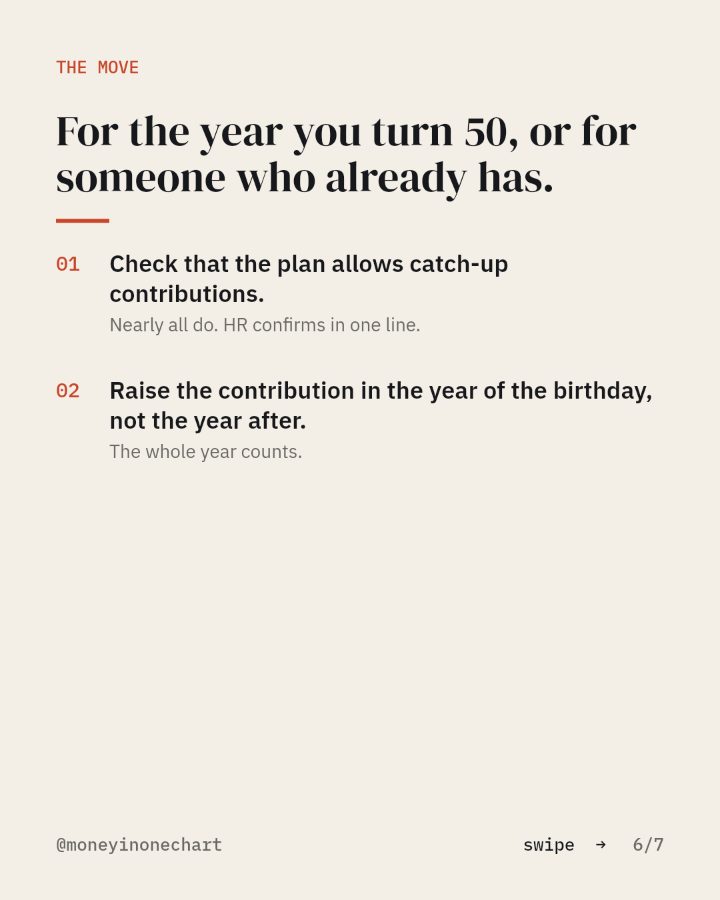
For the year you turn 50, or for someone who already has.
- 01Check that the plan allows catch-up contributions.Nearly all do. HR confirms in one line.
- 02Raise the contribution in the year of the birthday, not the year after.The whole year counts.
The tool this chart points at
A low-fee brokerage
For the IRA, the index fund and the rollover. Broad index funds with expense ratios under 0.1%.
Open itThis link may pay Money in One Chart a referral fee if you open an account. Your price does not change. How that works.
Sources: IRS IR-2025-111 for the limit; arithmetic for the growth.